The great thing about fact-based decisions is that they overrule the hierarchy.
—Jeff Bezos, founder of Amazon [1]
Measure and Grow
Measure and Grow is an approach SAFe enterprises use to evaluate progress towards Business Agility and determine improvement actions.
Business Agility sets new performance standards for organizations, requiring fast, effective responses to emerging business opportunities. However, to improve speed and agility, leaders, teams, and business stakeholders need a way to reliably measure the current state and identify what they can do to improve. Therefore, choosing what and how to measure is a critical enabler of continuously improving business performance. This article describes a comprehensive approach that can be used to measure the performance of a SAFe portfolio or any of its elements.
Details
When it comes to metrics, the first and most important thing is understanding what to measure. The goal of Business Agility is clear: quickly respond to market changes and emerging opportunities with innovative, digitally-enabled business solutions. The Business Agility Value Stream, shown in Figure 1, visualizes the steps needed to achieve this. SAFe’s three measurement domains, Outcomes, Flow, and Competency, support this process and provide a comprehensive yet simple model for measuring progress toward this goal. The insights provided by these three measurement domains support better decision-making and help to identify opportunities for improvement.

The three measurement domains are defined as follows:
- Outcomes: Do our solutions meet the needs of our customers and the business?
- Flow: How efficient is the organization at delivering value to the customer?
- Competency: How proficient is the organization in the practices that enable business agility?
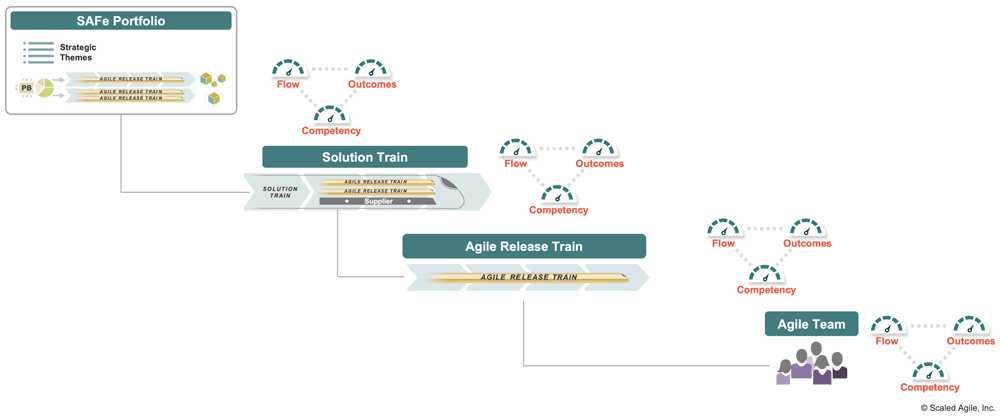
Furthermore, these three measurement domains are applicable at every level of an organization. As Figure 2 illustrates, they can be used to measure performance within a SAFe portfolio, a Solution Train, an Agile Release Train, or even a single Agile Team.
Each measurement domain contains a set of specific metrics, which are described in the sections below.
Measuring Outcomes
Outcomes help determine whether a development organization’s efforts produce the desired business benefit. Outcomes may measure externally facing concerns such as increases in revenue, customer retention, etc., as well as internal considerations such as employee engagement.
KPIs and OKRs
A SAFe Portfolio measures outcomes using Key Performance Indicators (KPIs) and Strategic Themes. Each KPI is a specific and quantifiable measure of business results for the value streams within that portfolio. Outcome metrics of this kind are typically context-specific and depend heavily on the organization, business model, and the nature of solutions delivered to the customer. For example, the customer conversion rate may be a meaningful metric for an eCommerce business but would be inapplicable to a microchip manufacturer. Some indicators, however, may be successfully applied across contexts, such as Net Promoter Score, for example.
The Value Stream KPIs article provides guidance for defining appropriate KPIs for that particular SAFe Portfolio. Examples of KPIs appear in Figure 3.

Of course, these KPIs are partly informed by the portfolio strategic themes since the strategy helps to determine the targets to be met. However, whereas KPIs represent ongoing ‘health’ metrics that can be used to measure overall business performance, the strategic themes, formulated as OKRs, define the specific outcomes that the portfolio is working towards to achieve future success. Therefore the key results associated with these objectives determine another set of critical outcome metrics that are typically measured quarterly, as shown in Figure 4 below.

Within a large portfolio, it can be useful to create specific OKRs for each value stream that align with the portfolio strategic themes. And further, for large value streams that contain multiple ARTs, this process can be repeated to create a set of OKRs that define the goals for each specific ART. This approach also allows those at each level of the organization to see the direct impact of their work against the key results of the OKRs they are aligning to. (This use case, and others, are described in more detail in the OKRs article)
Employee Engagement
Another important internal outcome metric is employee engagement. Employee engagement measures the amount to which individuals feel motivated and actively engaged in supporting the achievement of the organization’s goals and values. Higher levels of employee engagement result in higher productivity, efficiency, and innovation levels. Consequently, lower levels of employee engagement can lead to poor motivation, lower-quality work, and higher staff turnover.
Different methods exist for measuring employee engagement, and each organization needs to determine what is right for them. Some organizations will use an annual employee engagement survey. Others use an employee Net Promoter Score (eNPS), which asks, ‘How likely are you to recommend your employer to others as a place of work?’ and is measured on a 10-point scale. Whichever approach is chosen, the resultant data should inform initiatives to improve employee engagement levels.
Iteration Goals and PI Objectives
Localized metrics such as Iteration Goals and PI Objectives are used effectively by teams and trains to measure whether they are achieving their outcomes. These ensure their efforts are focused on the needs of the customer and the business, provide feedback on the progress they are making toward business results, inform the prioritization process, and facilitate acceptance of work.
Establishing effective outcome metrics requires a close collaboration of trains, value streams, and portfolios with their business partners, who can best define the business benefits resulting from solution investment.
Measuring Flow
Flow measures are used to determine how effective an organization is at delivering value. The Flow Framework created by Mik Kersten [2] provides five metrics that can be used to measure different aspects of flow. As SAFe is a flow-based system, each metric is directly applicable. In addition, SAFe defines Flow Predictability to measure how Teams, ARTs, and Solution Trains deliver business value against their planned objectives. These six flow metrics are shown in Figure 5 and described further below.

Flow Distribution
What does it measure? Flow distribution measures the amount of each type of work in the system over time. This could include the balance of new business Features (or Stories, Capabilities, or Epics) relative to Enabler work, as well as the work to resolve defects and mitigate risks. Alternatively, a helpful view of portfolio flow distribution might illustrate the distribution of funding allocation across investment horizons.
How is this measured? One simple comparison is to count the number of each type of work item at any point in time. A more accurate measure might consider the size of each work item. Agile Teams may measure flow distribution per iteration, but PI boundaries are commonly used to calculate this at the ART level and above, as shown in Figure 6.
Why is this important? To balance both current and future velocity, it is important to be able to track the amount of work of each type that is moving through the system. Too much focus on new business features will leave little capacity for architecture/infrastructure work that addresses various forms of technical debt and enables future value. Alternatively, too much investment in technical debt could leave insufficient capacity for delivering new and current value to the customers. Target capacity allocations for each work type can then be determined to help balance these concerns. Returning to the portfolio example, tracking the distribution of funding across investment horizons provides a means to ensure a balanced portfolio that ensures both near- and long-term health.

Flow Velocity
What does it measure? Flow velocity measures the number of backlog items (stories, features, capabilities, epics) completed in a given timeframe; this is also known as the system’s throughput. (Figure 7).
How is this measured? As with flow distribution, the simplest measure of velocity is to count the number of work items completed over a time period such as an iteration or PI. Those items can be stories, features, capabilities, or even epics. However, since work items are not all the same size, a more common measure is the total number of completed story points for work items of a type over the timeframe.
Why is this important? All other things being equal, higher velocity implies a higher output and is a good indicator that process improvements are being applied to identify and remove delays from the system. However, the system’s velocity will not increase forever, and over time stability of the system is important. Significant drops in velocity highlight problems that warrant investigation.

Flow Time
What does it measure? Flow time measures the total time elapsed for all the steps in a workflow and is, therefore, a measure of the efficiency of the entire system. Flow Time is typically measured from ideation to production. Still, it can also be useful to measure Flow Time for specific parts of a workflow, such as code commit to deployment, to identify opportunities for improvement.
How is this measured? Flow time is typically measured by the average length of time it takes to complete a particular type of work item (stories, features, capabilities, epics). A histogram is a useful visualization of flow time (Figure 8) since it helps identify outliers that may need attention and supports the goal of reducing the overall average flow time.
Why is this important? Flow time ensures that organizations and teams focus on what is essential – delivering value to the business and customer in the shortest possible time. The shorter the flow time, the less time our customers spend waiting for new features and the lower the cost of delay incurred by the organization.

Flow Load
What does it measure? Flow load indicates how many items are currently in the system. Keeping a healthy, limited number of active items (limiting work in process) is critical to enabling a fast flow of items through the system (SAFe Principle #6).
How is it measured? A Cumulative Flow Diagram (CFD) is one common tool used to effectively visualize flow load over time (Figure 9). The CFD shows the quantity of work in a given state, the rate at which items are accepted into the work queue (arrival curve), and the rate at which they are completed (departure curve). At a given point in time, the flow load is the vertical distance between the curves.

Why is this important? Increasing flow load is often a leading indicator of excess work in process. All other things being equal, the likely result will be an increase in future flow times as queues start to build up in the system. For this reason, measuring and reducing flow load is of critical importance. Furthermore, it is easy to see how more frequent delivery lowers flow load while improving flow time and flow velocity.
Flow Efficiency
What does it measure? Flow efficiency measures how much of the overall flow time is spent in value-added work activities vs. waiting between steps.
How is it measured? To correctly measure flow efficiency, the teams, trains, and value streams must clearly understand what the flow is in their case and what steps it passes through. This understanding is achieved with the help of Value Stream Mapping – a process of identifying workflow steps and delays in a system. (For more on Value Stream Mapping, see the Continuous Delivery Pipeline article and [3]. In addition, Scaled Agile’s Value Stream Mapping Workshop and SAFe DevOps course provide comprehensive guidance on performing Value Stream Mapping.) Once the steps have been mapped, flow efficiency is calculated by dividing the total active time by the flow time and is expressed as a percentage, as shown in Figure 10.
Why is this important? In a typical system that has not yet been optimized, flow efficiency can be extremely low, often in single digits. Low flow efficiency indicates excessive bottlenecks and delays in the system. Conversely, the higher the flow efficiency, the better the system can deliver value quickly.

Flow Predictability
What does it measure? Flow predictability measures how well teams, ARTs, and Solution Trains can plan and meet their PI objectives.
How is it measured? Flow Predictability is measured via the ART Predictability Measure, Figure 11. This measure calculates the ratio of actual business value delivered in a PI to the planned business value. For more information on calculating this important metric, see the Inspect and Adapt article.
Why is this important? Low or erratic predictability makes delivery commitments unrealistic and often highlights underlying problems in technology, planning, or organization performance that need addressing. Reliable trains should operate in the 80 – 100 percent range; this allows the business and its stakeholders to plan effectively.


Note on DORA Metrics: Within and across the three measurement domains, it can often be helpful to bring together complementary metrics to provide a specific view of performance. An example is the DORA metrics used to measure the performance of an organization’s DevOps capabilities [4]. The four DORA metrics are 1) deployment frequency, 2) lead time for changes, 3) time to restore service, and 4) change failure rate.
Each of these is an application of a flow metric designed for a particular use case. Deployment frequency is a productivity metric and an example of flow velocity. Instead of stories completed per iteration, it measures the number of deployments per given time period. Both lead time for changes and time to restore service are examples of flow time metrics, focusing on specific steps in the workflow. Finally, change failure rate represents the percentage of changes that require remediation after they have gone to production. In other words, how often does the work that arrives at the ‘deploy to production’ step in the workflow contain errors? When creating a value stream map to measure flow efficiency, this is captured in the percent complete and accurate (%C&A) metric for each step i.e. the percentage of work that the next step can process without needing rework. High rates of change failure contribute significantly to low flow efficiency.
Measuring Competency
Achieving business agility requires a significant degree of expertise across the Seven SAFe Core Competencies. While each competency can deliver value independently, they are also interdependent in that true business agility can be present only when the enterprise achieves a meaningful state of mastery of all.
Measuring the level of organizational competency is accomplished via two separate assessment mechanisms designed for significantly different audiences and different purposes. The SAFe Business Agility Assessment is designed for the business and portfolio stakeholders to assess their overall progress on the ultimate goal of true business agility, as shown in Figure 12.

The spreadsheet version of the assessment can be downloaded here.
Note for SAFe Studio Members: All the SAFe assessments are available for SAFe Studio Members online through our partner Comparative Agility. This provides additional data collection, analysis, comparison, and trending capabilities that can be used to improve performance. Access these from the Measure and Grow SAFe Studio page.
The SAFe Core Competency Assessments help teams and trains improve on the technical and business practices they need to help the portfolio achieve that larger goal. There is one for each of the seven core competencies. The Team and Technical Agility Assessment as an example, in Figure 13.

Each assessment follows a standard process pattern of running the assessment, analyzing the results, taking action, and celebrating successes. In addition, comparative analysis against the competition is achievable via online assessment tools available to SAFe community members. Additional information and guidance can be found in the Advanced Topic Article Successfully Facilitating SAFe Assessments.
The following table provides download links for each of the core competency assessments.
Measuring and Managing DevOps Maturity
In addition to the business agility and core competency assessments, the SAFe DevOps Health Radar (Figure 14) is an assessment that helps ARTs and Solution Trains optimize their value stream performance. It provides a holistic DevOps health check by assessing the maturity of the four aspects and 16 activities of the continuous delivery pipeline. The Health Radar is used to measure baseline maturity at any point in a DevOps transformation and guide fast, incremental progress thereafter.
Note: The DevOps Health Radar should be used alongside the Agile Product Delivery assessment to ensure full coverage of all three dimensions of the APD core competency.

The spreadsheet version of the DevOps Health Radar assessment can be downloaded here.
Four Critical Success Factors for Effective Measurement
Measuring organizational performance is one of the most sensitive areas in every business, often subject to politics and various dysfunctions. Additionally, since measurement inevitably involves the interpretation of data, it is subjected to cognitive bias, communication issues, and alignment disconnects. All this leads to a substantial danger in any measurement system: if not correctly implemented, some measurements can do more harm than good. The following success factors will help guide the enterprise to more effective measurements and more importantly, better business results.
1. Use measurement in conjunction with other discovery tools
However well-designed, any measurement system provides only a partial picture of reality, and adding more metrics does not necessarily improve visibility. There is a story behind every number, and that story often contains more important information than the number itself can convey. A powerful tool to be used in conjunction with measurement is direct observation (Gemba) – observation of the actual environment where value is created and where it meets the customer. Formal measures and informal observations reinforce one another. But used in isolation, ‘managing by just the numbers’ can lead to poor outcomes and even worse morale.
2. Apply metrics where they support improved decision-making
A common trap when applying metrics is over-measuring for fear of not measuring enough. Although many metrics can be automated, as the number of metrics and frequency of measurement increases, so will the effort needed to collect and analyze the data. When considering whether to include an additional metric in your measurement system it can be prudent to ask the question, ‘what decisions will this metric help inform that isn’t supported today with our existing metrics?’ If the new metric helps to drive better decision-making, it should be a candidate for inclusion; if not, then omit it. A further clarifying question is ‘do we need to measure this right now?’ This question recognizes that the metrics we use will change over time as the decisions we need to make change throughout the development process.
3. Understand the effect of metrics on behaviors
In a positive culture, knowledge workers are motivated to deliver winning solutions and work with purpose, mastery, and autonomy. However, when too much emphasis is placed on a specific numerical indicator, and when that indicator is directly tied to compensation or career growth opportunities, achieving that number becomes the goal instead of creating effective solutions.
Additionally, the pressures to succeed often lead to the misuse of metrics. For example, flow efficiency may be used to assign blame for a missed delivery date to a particular ART that has become a bottleneck rather than using this information to identify systemic problems that need addressing. Perhaps the root cause was a lack of resources or changing priorities outside the ART’s control.
In each case, SAFe’s Core Values of transparency and alignment must provide the proper foundation for an effective measurement system alongside creating an environment where the facts are always friendly.
4. Interpret metrics carefully
Just collecting specific measures is not enough. If interpreted without proper understanding, an indicator may be quite misleading. For example, when measuring flow time, the work items must be actual, valuable features (stories, and so on) that carry business benefits; otherwise, the train may be reporting improvements in the flow of work but struggling to get any real value out of the door.
Learn More
[1] Hunt, Helena, ed. First Mover: Jeff Bezos In His Own Words. Agate Publishing, 2018.
[2] Kersten, Mik. Project to Product: How to Survive and Thrive in the Age of Digital Disruption with the Flow Framework. IT Revolution Press, 2018.
[3] Martin, Karen, and Mike Osterling. Value Stream Mapping: How to Visualize Work and Align Leadership for Organizational Transformation. McGraw-Hill Education, 2018.
[4] Accelerate. 2023 State of DevOps Report. Google. Retrieved October 10, 2023, from https://cloud.google.com/devops/state-of-devops
Last update: 10 October 2023